Natural Gas Weekly Recap: The Weather Rug Pull & Vol Aftermath | Feb 1-5, 2026
NG's wild week - an 80+ cent sell-off, March vol crushed 32%, and the winter rally narrative gets tested. Free weekly market recap.
The Big Picture
What a week in natural gas. On Friday, some traders were saying we wouldn't see $2 this year. By Monday, many of those same traders were wishing they were farmers.
- Weather whipsaw strikes again: This winter's recurring pattern of cold forecasts turning warm continued — but the one time it didn't flip (over the long weekend), cash went to $50+ and futures past $7. That left scars.
- Overbought unwind: Heading into this past weekend, CTAs were max long and traders were nervous about getting caught again. Weather flipped warm, triggering a massive unwind.
- Historic sell-off: JV26 traded 500+ lots/day on screen in an unprecedented 80+ cent sell-off on the strip. Over 50,000 TAS contracts traded, followed by a rally into the close as stop-outs and CTA repositioning created violent two-way action.
Key Themes This Week
1. The $5 Strike Story
- $5.00 was identified as the highest open interest strike — the max pain level — before the long weekend.
- $5 options were trading at just 2 ticks. As weather continued to add cold and the market discussed the biggest storage draw ever, those 2-tick options reached 50 cents.
- OI on Feb $5 and $6 calls came down as both longs and shorts closed positions.
- Just before February OPEX on 01/26, activity in Feb $7 calls picked up — but CME had multiple problems on expiration day, and those $7 calls never went in the money.
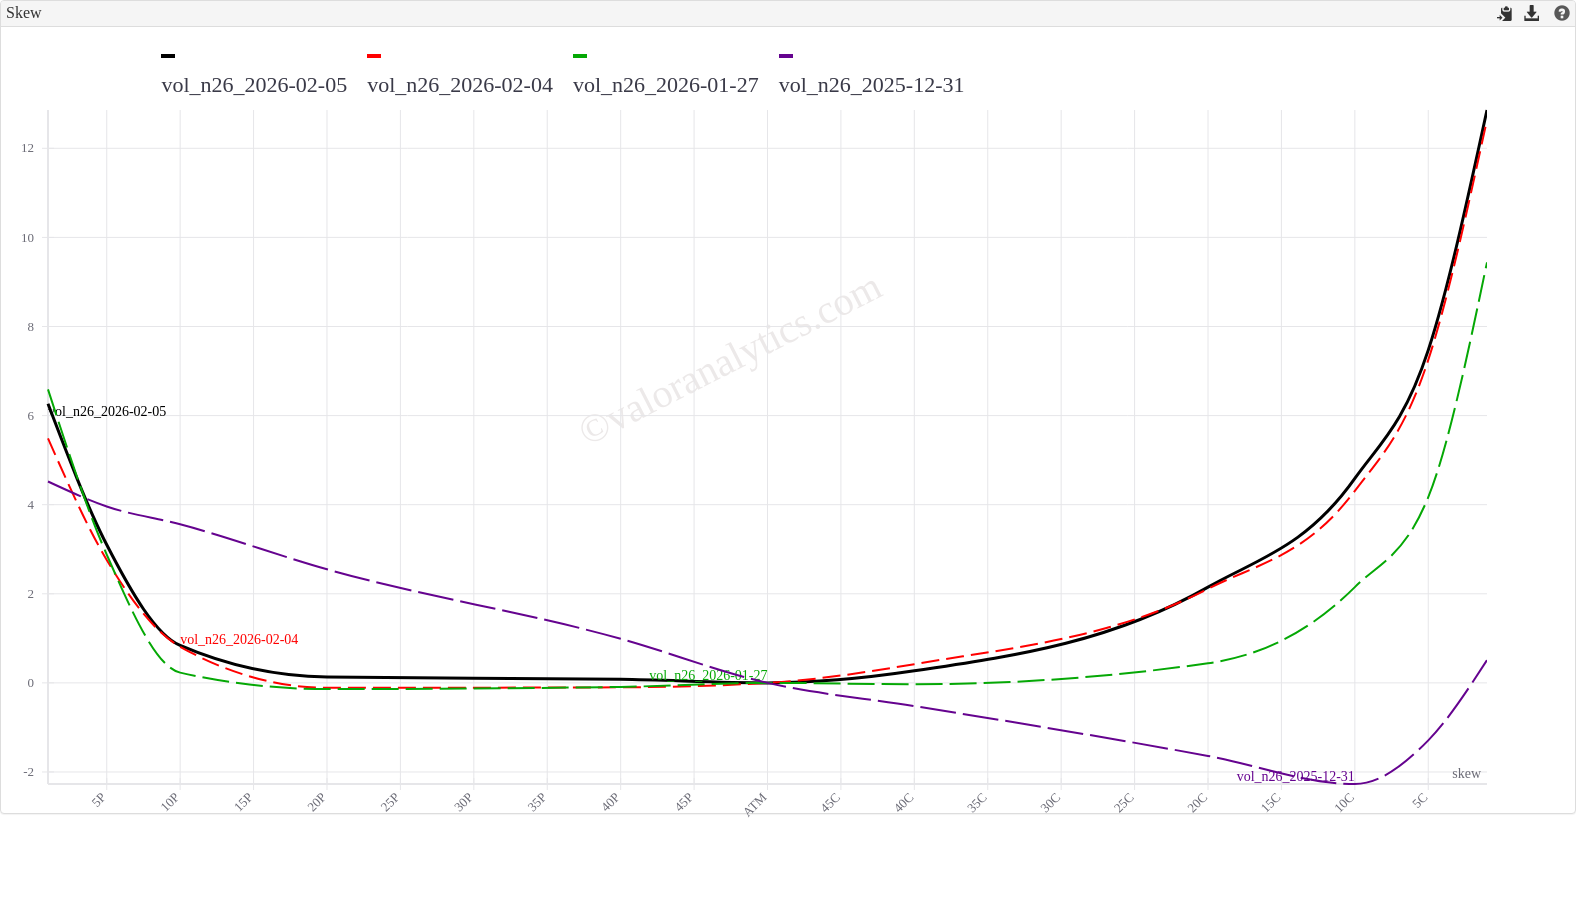
2. The Sell-Off & Vol Repricing
- March implied vol sold off roughly 32% from its highs — the move down in price was much larger than anyone expected.
- Skew dynamics were nuanced: The 4.50 calls that were near ATM on Friday ended up at roughly 20 delta after the sell-off, gaining vol from steeper skew even as ATM vol and call skew compressed.
- Vol changes by strike told a different story vs. delta: put vol declined while $4–$6 calls actually gained.
- May through August calls were making new highs, likely driven by lower end-of-season storage projections.
3. Options Flow: From Calls to Puts
- Early in the week: March $5.00 and $6.00 calls were the highest volume contracts — a change from the usual dominance of March $3.00 puts. Mar/Apr $1.00 call spreads were back at 3.5 cents, and V/F -$0.75 calls traded around 5.5 cents.
- Mid-week (EIA report): Came in slightly bearish (1 Bcf higher draw than expected at 359 Bcf), reversing the previous day's rally. Q2 put flies (3.00/2.75/2.50) started trading at 3 cents.
- Thursday (Baker Hughes): Haynesville rigs up +7, triggering another reversal. Mar 3.00/2.75 put spreads crossed in huge size at 4.2 cents, and Mar 2.75 puts saw 61,000+ contracts on CME.
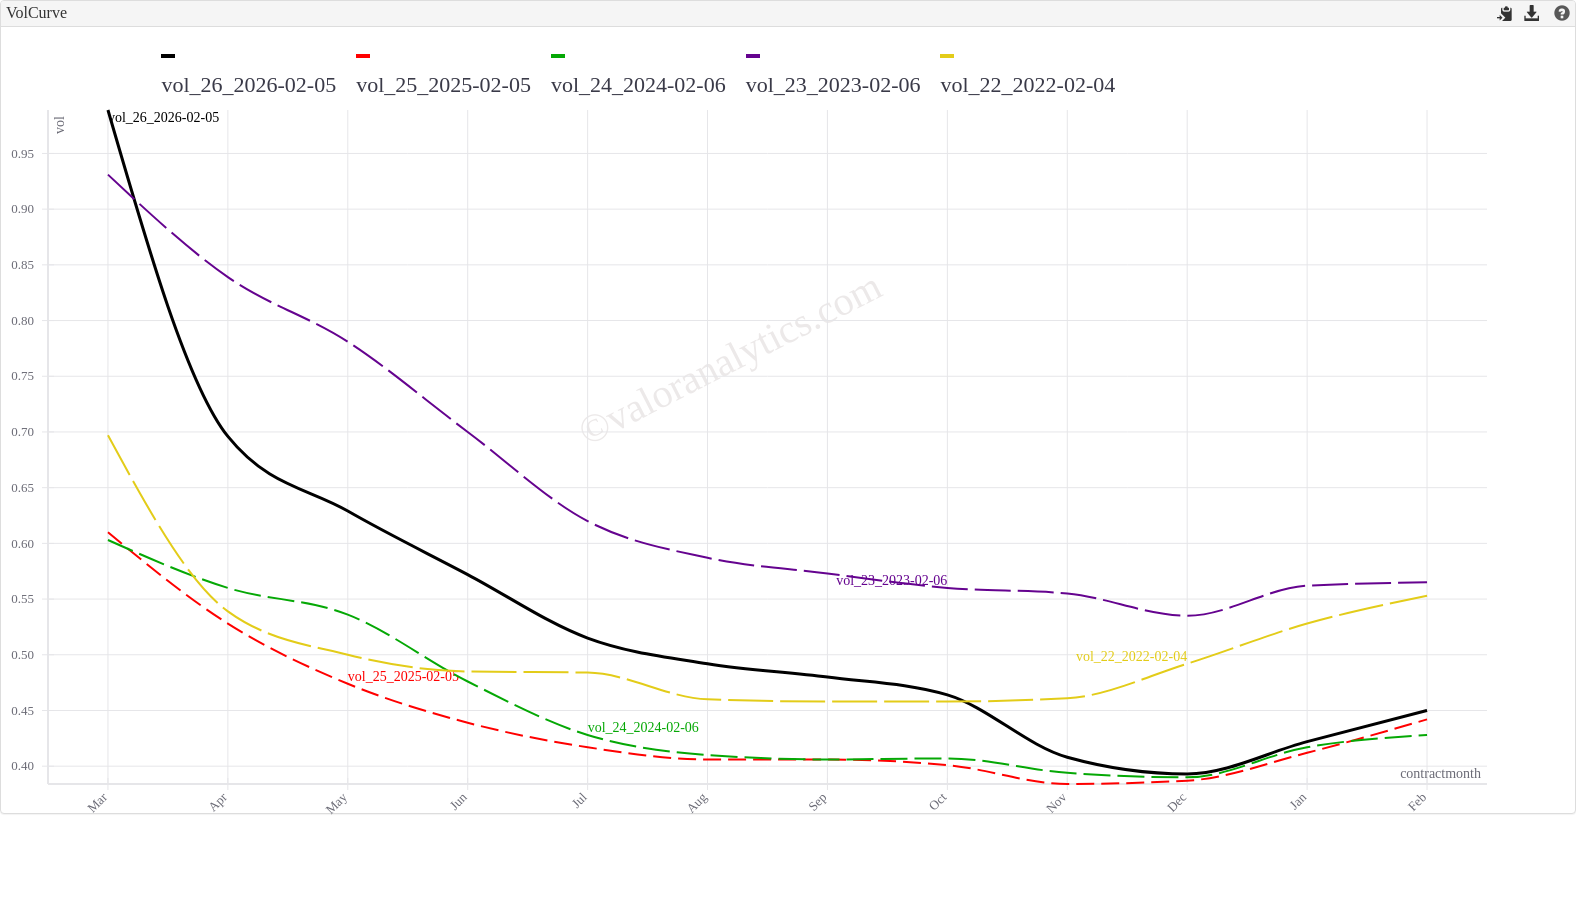
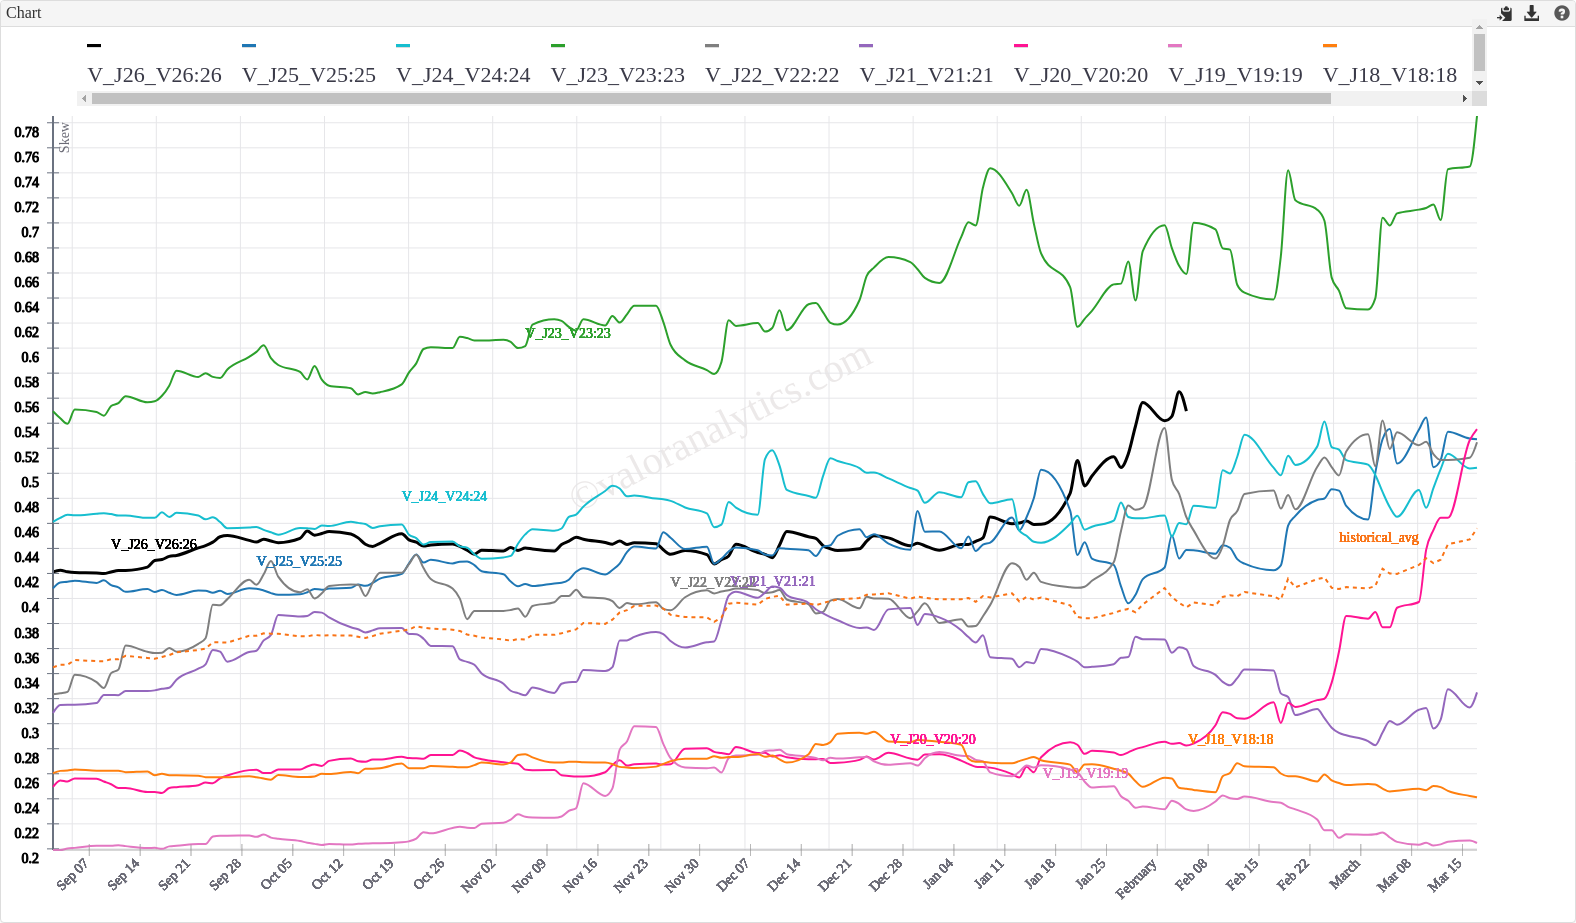
4. Back-Curve Vol & The Deferred Bid
- While front-month vol was getting crushed, the back of the curve told a different story.
- JV28 $4.00 calls were lifted at 28.5 cents early in the week.
- By Wednesday, JV27 was gapping higher on bids with $4.00 calls trading at 31 cents.
- Cal'28 was going bid across the board.
- Winter vol and summer '27 remained well supported even as the front corrected.
5. Storage, LNG & The Structural Puzzle
- End-of-season storage estimates: Settled around 1.6–1.7 Tcf on the Henry Hub side, with V26 balances at 3.7–4.0 Tcf.
- Key question: Do those levels justify $2-handle targets, or does the market need to stay elevated?
- LNG frustration: Even when Hub cash was north of $50, LNG barely budged — especially at Venture Global facilities.
- With SALTs running low and production still not back to pre-rally levels, the structural picture remains complicated even as weather risk fades.
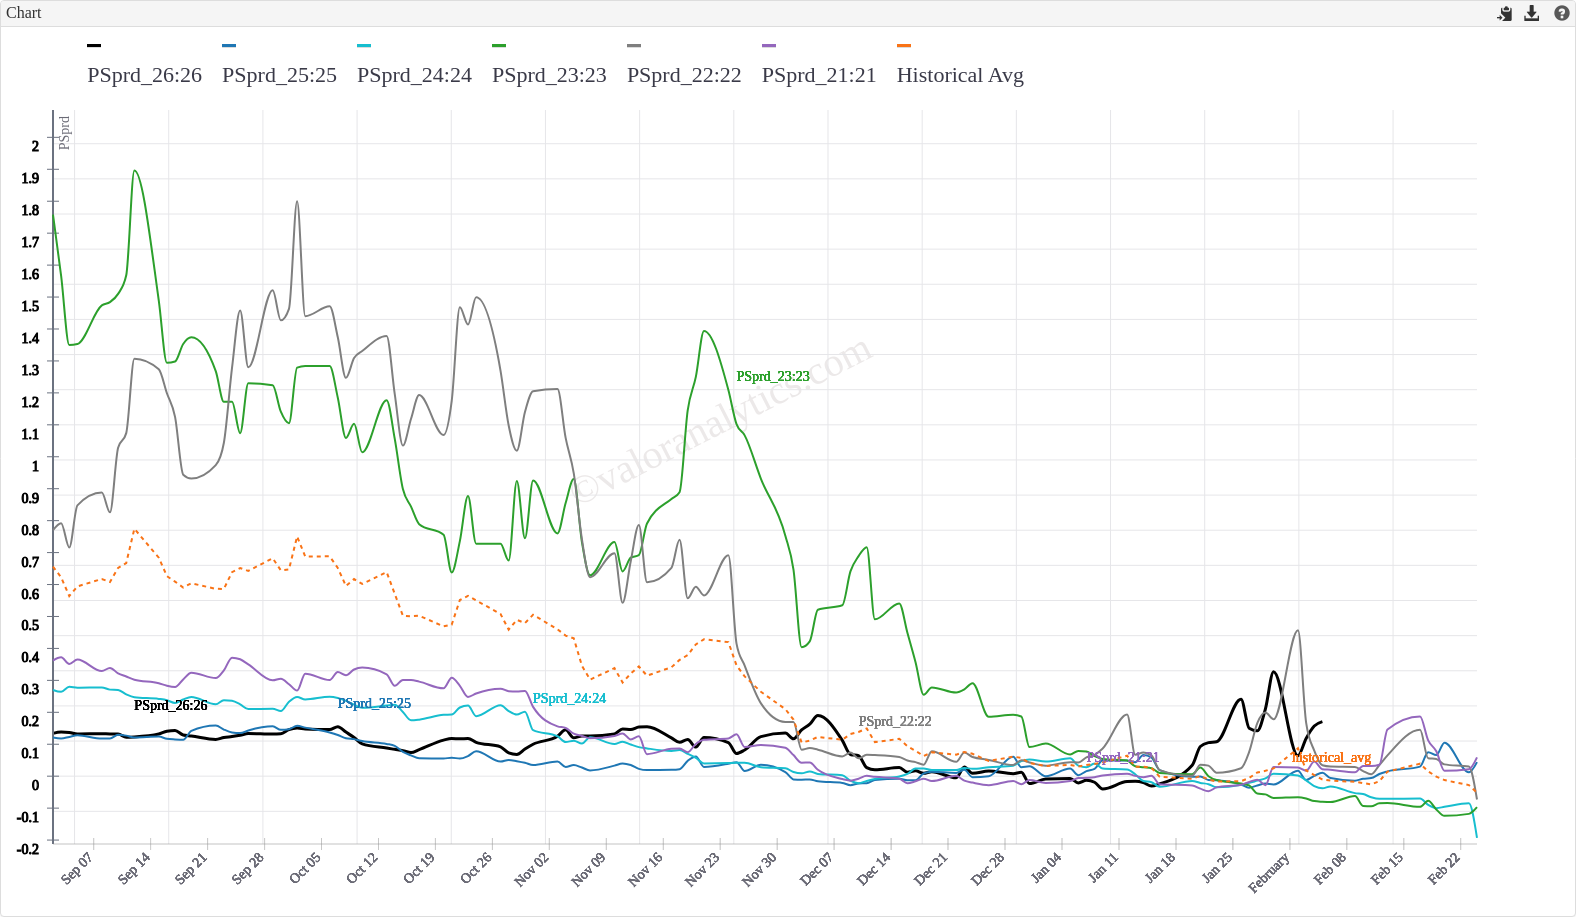
6. Spread Activity
- Oct/Jan spreads continued their widening theme.
- The -2.00/-0.50 fence traded at 3 cents to the puts.
- -1.25/-1.50/-1.75 put flies traded at 2.6 cents (a V/F widening to -1.50 trade).
- Mar/Apr structures and calendar spread options remained active as traders repositioned around the new seasonal outlook.
What We're Watching Next Week
- Weather models: This winter's pattern has been cold-flip-warm-repeat. Any shift back to cold could reverse the move just as quickly.
- March expiry dynamics: With vol crushed, gamma positioning into March expiry will be key. Breakevens are high without weather support.
- Back-curve vol: JV27 and Cal28 are seeing real demand. Is this the start of a sustained bid in deferred vol?
- Haynesville production: The +7 rig count already moved the market. Production recovery pace will shape the EoS narrative.
- EIA storage: The weekly number will either confirm or challenge the 1.6–1.7 Tcf EoS consensus.
Beyond the Surface: What Our Premium Reports Cover
This free weekly recap gives you the narrative — but the real edge is in the data. Our daily Valor View newsletter and VALR EOD Reports provide institutional-grade analytics including:
- 65+ daily charts covering straddle tables, skew progression, vol heatmaps, break-even surfaces, and seasonal overlays for NG, CL, and HO
- Option Matrix with vol changes by both strike and delta — critical for understanding how the skew reshapes on big moves
- Spread analytics (H/J, calendar spreads, CSOs) with historical context and the new Spreads Matrix with fly views
- Vol termstructure analysis showing exactly where the market is pricing risk across the curve
- Intraday volatility tracking across the full term structure
Want the full picture? Subscribe to Valor View for daily market intelligence delivered to your inbox, or reach out to learn about our VALR platform for real-time options analytics.